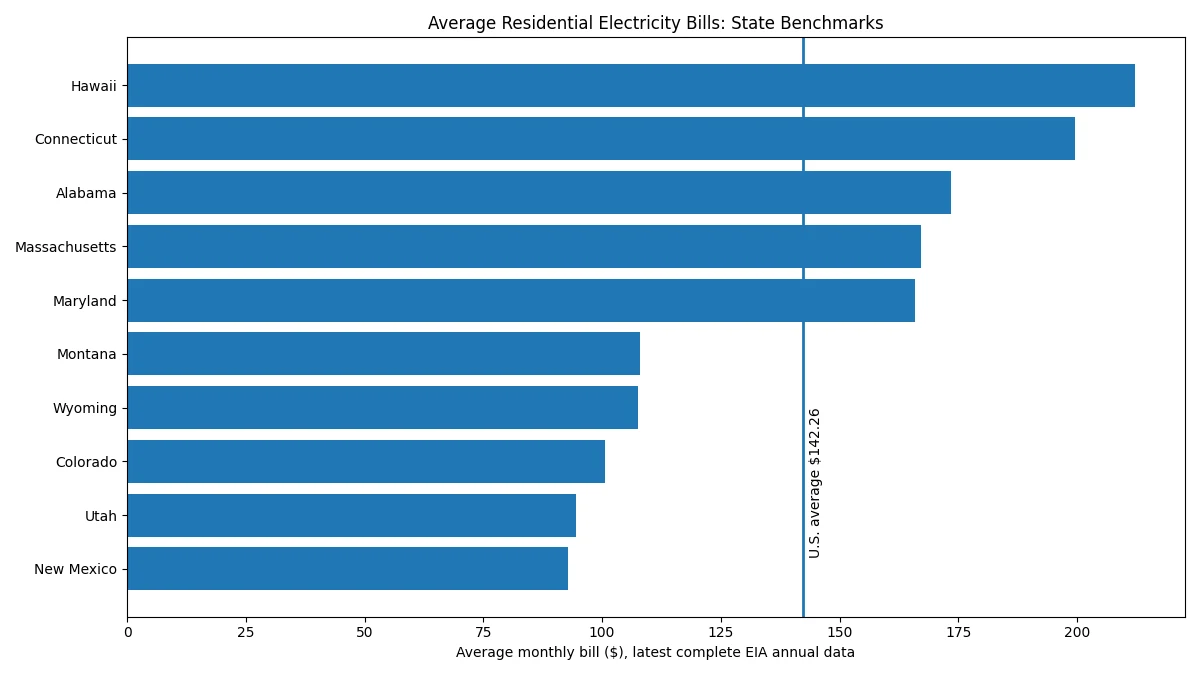
The average electricity bill USA benchmark is useful only when you know what year the data represents and how much electricity the household uses. As of September 2026, the latest complete U.S. Energy Information Administration annual state-by-state residential bill dataset is for 2024. It shows a U.S. average of $142.26 per month, based on average residential use of 863 kWh per month at an average retail price of 16.48¢/kWh.
For a more current price signal, EIA’s July 2026 monthly data shows a U.S. residential average electricity price of 18.31¢/kWh, up from 17.45¢/kWh in July 2025. That does not mean the average 2026 bill is simply $142.26 multiplied by the price increase: household usage, weather, tariffs and fixed charges also change. Use the state table below as a benchmark, then compare it with your own bill or enter your usage and rate in the HomeBillLab U.S. Electricity Bill Calculator.
Table of Contents
What is the average electricity bill in the USA?
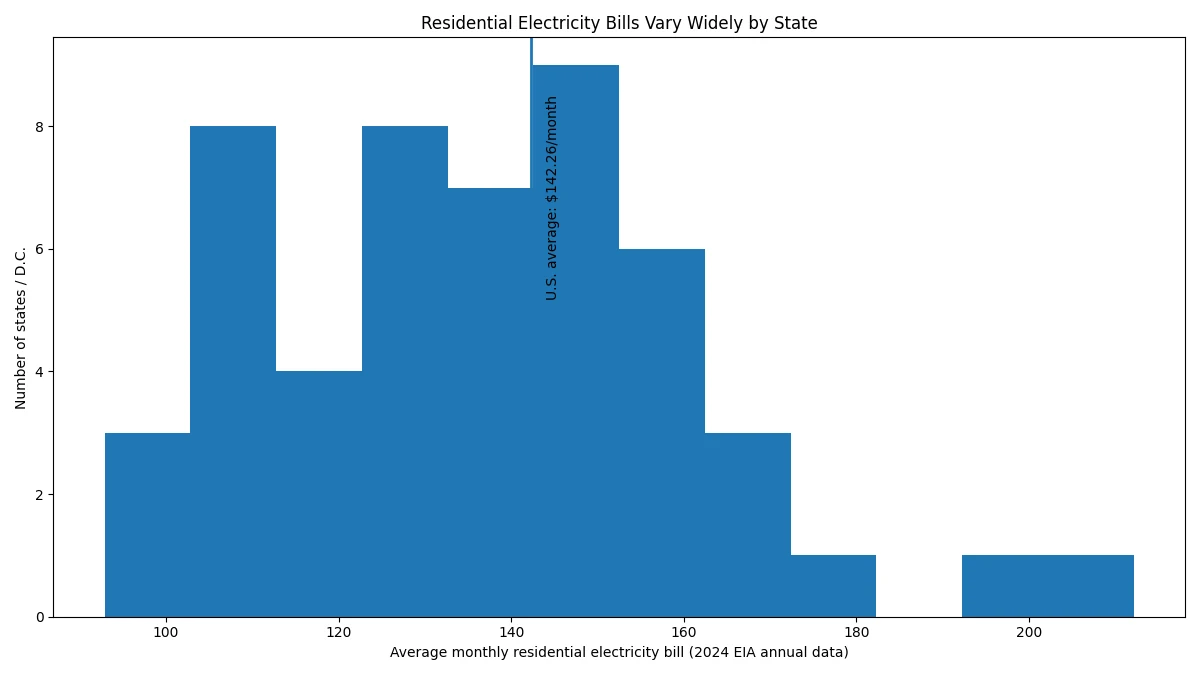
The latest official annual EIA benchmark is $142.26 per month for a U.S. residential customer in 2024. Annualized, that is about $1,707 per year. EIA’s Residential Average Monthly Bill table also reports 863 kWh of average monthly use and an average residential price of 16.48 cents per kWh for that year.
That national number is a benchmark, not a target and not a prediction for your home. The same table shows monthly state averages ranging from $92.88 in New Mexico to $212.12 in Hawaii. A household can also sit far above or below its state average depending on home size, electric heating, air-conditioning load, water heating, appliance use, insulation, occupancy and the utility rate plan.
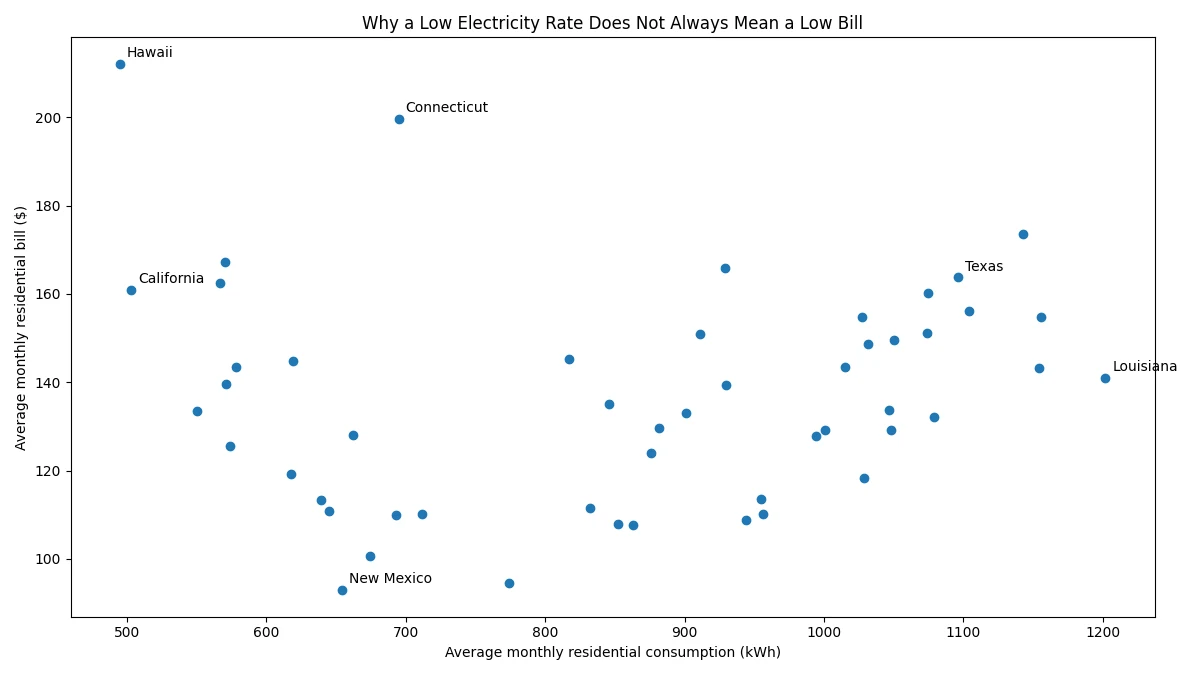
It is also important to separate an average bill from an average electricity price. The bill is the dollar amount a residential customer pays on average. The price in cents per kWh is one input into that bill. A state can have relatively inexpensive electricity but high consumption, producing a sizeable monthly bill. Another state can have expensive electricity but lower average use.
Average electricity bill USA by state: latest official annual bill data plus July 2026 price
For an average electricity bill USA comparison, the table below combines two EIA datasets so the dates are explicit. The first three numeric columns are from the latest complete annual residential bill dataset, covering 2024. The last column is the average residential electricity price for July 2026, released by EIA on September 24, 2026. The July figure is a preliminary monthly price estimate; it is included to show the current direction of rates, not to relabel the 2024 monthly bill as a 2026 bill.
| State / D.C. | 2024 avg monthly use | 2024 avg price | 2024 avg monthly bill | July 2026 avg price |
|---|---|---|---|---|
| Alabama | 1,143 | 15.18¢ | $173.50 | 16.40¢ |
| Alaska | 578 | 24.82¢ | $143.54 | 28.83¢ |
| Arizona | 1,075 | 14.91¢ | $160.24 | 15.38¢ |
| Arkansas | 1,048 | 12.32¢ | $129.13 | 14.33¢ |
| California | 503 | 31.97¢ | $160.86 | 33.61¢ |
| Colorado | 674 | 14.92¢ | $100.57 | 17.00¢ |
| Connecticut | 695 | 28.75¢ | $199.66 | 24.16¢ |
| Delaware | 911 | 16.57¢ | $150.87 | 18.48¢ |
| District of Columbia | 639 | 17.71¢ | $113.23 | 25.21¢ |
| Florida | 1,104 | 14.14¢ | $156.09 | 15.03¢ |
| Georgia | 1,074 | 14.08¢ | $151.25 | 16.27¢ |
| Hawaii | 495 | 42.86¢ | $212.12 | 48.00¢ |
| Idaho | 944 | 11.52¢ | $108.73 | 13.73¢ |
| Illinois | 693 | 15.87¢ | $109.99 | 19.22¢ |
| Indiana | 901 | 14.77¢ | $133.06 | 16.73¢ |
| Iowa | 832 | 13.40¢ | $111.54 | 15.99¢ |
| Kansas | 876 | 14.15¢ | $123.90 | 15.27¢ |
| Kentucky | 1,047 | 12.79¢ | $133.81 | 13.81¢ |
| Louisiana | 1,202 | 11.73¢ | $140.96 | 12.72¢ |
| Maine | 550 | 24.29¢ | $133.60 | 32.41¢ |
| Maryland | 929 | 17.86¢ | $165.87 | 21.41¢ |
| Massachusetts | 570 | 29.35¢ | $167.20 | 30.49¢ |
| Michigan | 618 | 19.30¢ | $119.31 | 23.05¢ |
| Minnesota | 712 | 15.45¢ | $110.06 | 17.45¢ |
| Mississippi | 1,156 | 13.39¢ | $154.83 | 14.54¢ |
| Missouri | 1,001 | 12.91¢ | $129.18 | 16.09¢ |
| Montana | 852 | 12.66¢ | $107.91 | 14.99¢ |
| Nebraska | 956 | 11.53¢ | $110.28 | 13.78¢ |
| Nevada | 930 | 15.00¢ | $139.39 | 12.77¢ |
| New Hampshire | 619 | 23.40¢ | $144.87 | 26.60¢ |
| New Jersey | 662 | 19.34¢ | $128.13 | 25.19¢ |
| New Mexico | 654 | 14.20¢ | $92.88 | 16.09¢ |
| New York | 571 | 24.43¢ | $139.53 | 29.90¢ |
| North Carolina | 1,015 | 14.13¢ | $143.50 | 15.16¢ |
| North Dakota | 1,029 | 11.51¢ | $118.38 | 13.41¢ |
| Ohio | 846 | 15.99¢ | $135.16 | 19.45¢ |
| Oklahoma | 1,079 | 12.24¢ | $132.05 | 14.35¢ |
| Oregon | 882 | 14.70¢ | $129.62 | 15.97¢ |
| Pennsylvania | 817 | 17.77¢ | $145.17 | 21.72¢ |
| Rhode Island | 567 | 28.65¢ | $162.40 | 28.29¢ |
| South Carolina | 1,050 | 14.23¢ | $149.51 | 15.47¢ |
| South Dakota | 994 | 12.86¢ | $127.81 | 15.37¢ |
| Tennessee | 1,154 | 12.42¢ | $143.32 | 13.71¢ |
| Texas | 1,096 | 14.94¢ | $163.72 | 15.88¢ |
| Utah | 774 | 12.22¢ | $94.57 | 13.12¢ |
| Vermont | 574 | 21.90¢ | $125.66 | 23.75¢ |
| Virginia | 1,032 | 14.41¢ | $148.77 | 17.55¢ |
| Washington | 955 | 11.90¢ | $113.68 | 14.71¢ |
| West Virginia | 1,027 | 15.07¢ | $154.76 | 15.78¢ |
| Wisconsin | 645 | 17.18¢ | $110.87 | 19.06¢ |
| Wyoming | 863 | 12.47¢ | $107.65 | 14.36¢ |
Source: U.S. Energy Information Administration annual residential bill data and EIA Electric Power Monthly Table 5.6.A. For the latest annual release schedule and downloadable tables, see EIA’s Electric Sales, Revenue, and Average Price page.
Which states have the highest and lowest average electricity bills?
Using the latest complete annual bill dataset, the highest average monthly residential bills were concentrated in a mix of high-price states and high-consumption states. Hawaii was highest at $212.12 per month, followed by Connecticut at $199.66. Alabama averaged $173.50, Massachusetts $167.20 and Maryland $165.87. Texas, Rhode Island, California, Arizona and Florida also ranked among the ten highest state averages.
At the lower end, New Mexico averaged $92.88 per month, Utah $94.57 and Colorado $100.57. Wyoming, Montana, Idaho, Illinois, Minnesota, Nebraska and Wisconsin rounded out the ten lowest averages in the 2024 EIA table.
Those rankings should not be interpreted as a simple list of the “cheapest” and “most expensive” electricity markets. The average monthly bill combines both the rate and the amount of electricity consumed. Climate, housing stock and electric end uses can change the result substantially.
Why a low electricity rate does not always mean a low bill
The clearest way to understand an average electricity bill USA comparison is to look at price and usage together. In the 2024 annual data, California had an average residential price of 31.97¢/kWh and average use of only 503 kWh per month, producing a $160.86 average bill. Louisiana, by contrast, had a much lower average price of 11.73¢/kWh but much higher average use of 1,202 kWh per month, producing a $140.96 average bill.
In other words, rate alone does not determine the bill. A household that uses twice as much electricity can spend more even when its rate is significantly lower. This is why HomeBillLab separates electricity cost per kWh from whole-bill calculations.
The same principle matters inside a single state. Two neighboring homes on the same utility tariff can have very different bills if one uses central air conditioning heavily, has electric resistance heating, heats water with electricity or has more occupants. The state average is therefore a comparison point rather than an estimate for a specific address.
How to use the average electricity bill USA benchmark to estimate your own bill
The average electricity bill USA number is only a benchmark. A useful household estimate starts with your expected monthly consumption and the variable electricity price:
Monthly energy charge ≈ monthly kWh × electricity rate in $/kWh
For example, 900 kWh at 18¢/kWh produces about $162 in energy charges before any fixed customer charge or other bill components that are not already included in the rate you entered. If your utility rate is shown as cents per kWh, divide by 100 before multiplying: 18¢/kWh = $0.18/kWh.
Real bills can include customer charges, minimum charges, tiered prices, time-of-use prices, riders, taxes, credits, fuel adjustments or separate supply and delivery components. That is why the best input is the rate structure on your own bill. If you are comparing an appliance or HVAC load rather than the total household bill, use the variable charges that change when you consume another kWh instead of assigning every fixed monthly fee to one appliance.
The U.S. Electricity Bill Calculator is designed for this household-level calculation. Use actual kWh from a recent bill when possible, then test different usage levels rather than relying only on a national or state average.
What changes the average electricity bill from one home to another?
1. Climate and air-conditioning demand
Hot, humid climates can drive long air-conditioning runtimes during summer. That helps explain why several southern states have high monthly consumption even when their cents-per-kWh rates are not among the highest in the country. Cooling equipment efficiency, thermostat settings, insulation, duct leakage and house size all affect the final kWh total.
2. Electric space heating
Winter electricity use can rise sharply in homes that rely on electric resistance heating. Heat pumps can deliver more heat per unit of electricity than resistance systems under appropriate conditions, but actual seasonal consumption still depends on climate, equipment performance, backup heat and indoor temperature settings.
3. Water heating
Electric water heating can be a significant year-round load. Household size, shower habits, incoming water temperature, tank losses and heater type all affect consumption. A home with gas water heating may shift part of that energy spending away from the electric bill, which makes electric-bill comparisons between homes less direct.
4. Home size, occupancy and appliance use
Larger homes usually have more conditioned space and often more appliances, but size alone does not determine the bill. A smaller all-electric home with heavy cooling demand can use more electricity than a larger home that heats with gas and has efficient HVAC equipment. Occupancy, remote work, electric vehicle charging, pools and other loads can also materially change monthly use.
5. Utility territory and rate design
State averages hide utility-level differences. Retail rates can vary by provider, service territory and plan. Some customers pay a simple flat energy rate, while others face tiers, seasonal rates or time-of-use periods. Fixed charges can also differ, so two customers with the same monthly kWh may still receive different bills.
How should you compare your bill with the state average?
When comparing your home with an average electricity bill USA benchmark, start with the same billing period. Compare a full month with a monthly state benchmark rather than comparing a 28-day bill with a 31-day average. Next, compare consumption in kWh before comparing dollars. If your usage is far above the state average, the main question may be what is driving consumption. If your kWh is similar but your bill is much higher, the rate plan, fixed charges or other bill components deserve a closer look.
Season also matters. A yearly average smooths out summer and winter peaks. A household in a hot climate may have a much higher July bill than its annual monthly average, while a cold-climate all-electric home may peak in winter. The current EIA monthly price data is useful for tracking rate changes, but it does not replace a full-year consumption profile.
What does the July 2026 electricity price tell us?
EIA’s July 2026 monthly table reports a U.S. residential average of 18.31¢/kWh, compared with 17.45¢/kWh in July 2025, an increase of about 4.9%. State prices remained widely dispersed: Hawaii averaged 48.00¢/kWh, California 33.61¢, Maine 32.41¢ and Massachusetts 30.49¢ in that month, while several states remained in the low-to-mid teens.
These monthly price figures are preliminary EIA estimates and should not be converted directly into a claimed 2026 “average bill” without matching them to actual 2026 consumption and customer data. Their value is freshness: they show that the retail-price environment has moved since the latest annual bill table.
2026 data freshness: why this page separates annual bills from current prices
EIA’s Electric Sales, Revenue, and Average Price release page says the latest complete annual data is for 2024, released October 7, 2025, with the next annual release scheduled for October 2026. That timing matters. Publishing a table labeled “2026 average electricity bill by state” using old annual dollar figures without explaining the source year would be misleading.
HomeBillLab therefore uses the latest official annual bill figures for the state-by-state dollar benchmark and the latest available monthly EIA price table for current context. We will update the annual bill column after EIA publishes the next full annual dataset. High-freshness pages like this one are reviewed more often than evergreen appliance formulas. See the HomeBillLab Methodology for how we date sources, separate observed data from examples and handle changing tariffs.
Average electricity bill USA FAQ
What is the average monthly electric bill in the United States?
The latest complete annual EIA state bill dataset shows a U.S. residential average of $142.26 per month for 2024. The figure is based on 863 kWh of average monthly consumption at 16.48¢/kWh.
What is the average electricity price in the USA in 2026?
EIA’s July 2026 monthly data reports a U.S. residential average of 18.31¢/kWh. That is a monthly price benchmark, not a complete annual average bill.
Which state has the highest average electricity bill?
In the latest complete annual EIA bill table, Hawaii had the highest average monthly residential bill at $212.12 in 2024. Connecticut was next at $199.66.
Which state has the lowest average electricity bill?
New Mexico had the lowest state average in the 2024 EIA table at $92.88 per month, followed by Utah at $94.57 and Colorado at $100.57.
Why is my bill higher than my state’s average?
Your home may use more electricity than average, your utility may charge a higher rate than the statewide average, or your bill may include fixed charges and other components. Electric heating, air conditioning, water heating, home size, occupancy and EV charging can all raise monthly kWh.
Should I use the national average to estimate my own bill?
Use it only as a benchmark. Your own monthly kWh and utility rate are much better inputs. If you have a recent bill, enter those values into the calculator instead of substituting the national average.
Bottom line
The average electricity bill USA benchmark is currently $142.26 per month in the latest complete annual EIA dataset, but state averages differ by more than $100 per month and current electricity prices have moved since that annual period. Use the state table to understand where your bill sits, then use your actual kWh, tariff and fixed charges for a household-specific estimate. Browse more guides in the U.S. Electricity hub.