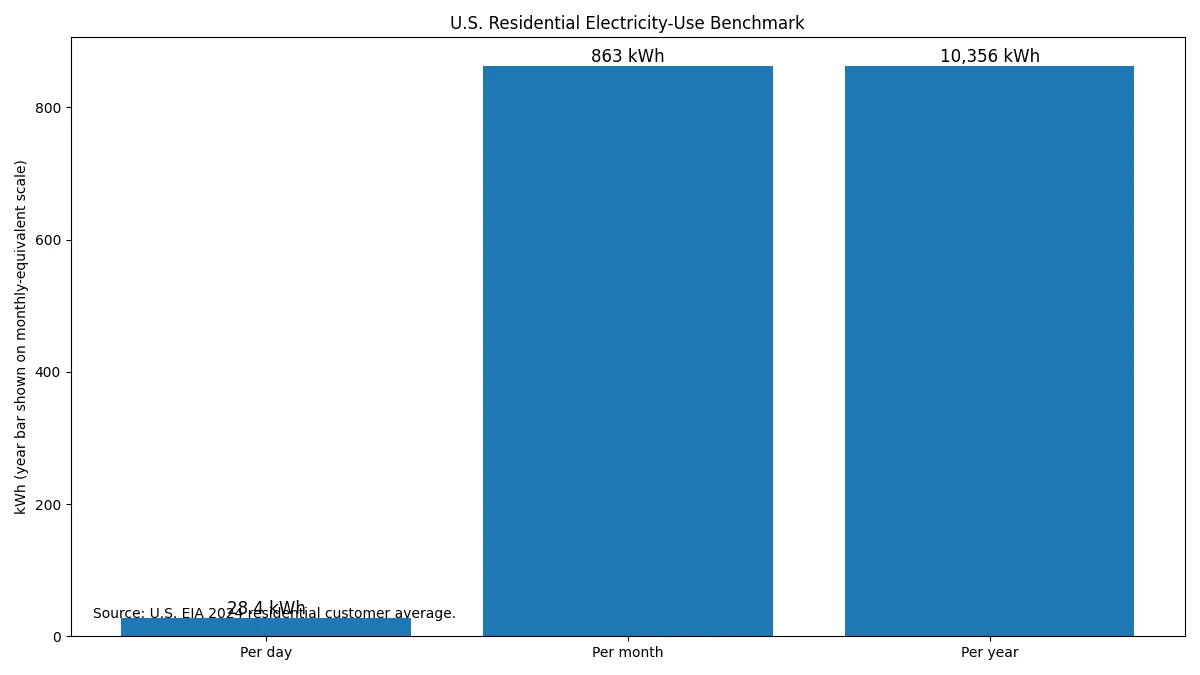
If you are asking how much electricity does a house use per day in the United States, the latest complete annual U.S. Energy Information Administration residential-customer benchmark is a useful starting point: 863 kWh per month in 2024. Spread across a full year, that works out to about 28.4 kWh per day, roughly 199 kWh per week, and 10,356 kWh per year.
That number is a national average, not a target for every house. It combines many types of residential customer accounts across all 50 states and the District of Columbia. A small apartment with gas space heating can use much less electricity than an all-electric detached home with heavy air-conditioning, electric water heating, an EV or a pool. For your own home, the best benchmark is your last 12 months of kWh from utility bills. Once you know your usage, the HomeBillLab U.S. Electricity Bill Calculator can turn that usage and your actual rate into a cost estimate.
Table of Contents
How much electricity does a house use per day in the USA?
Using the latest complete EIA annual residential bill table, the national average residential customer used 863 kWh per month in 2024. Because a calendar year has 365 days, the annualized daily figure is:
863 kWh/month × 12 months ÷ 365 days = 28.4 kWh/day.
The same benchmark is about 10,356 kWh per year. EIA’s official 2024 Average Monthly Bill — Residential table is the source used here because it publishes the national customer count, average monthly consumption, price and bill in one consistent annual dataset. The U.S. total row reports 143.1 million residential customer accounts and 863 kWh of average monthly grid-delivered electricity.
Do not read 28.4 kWh/day as if a typical home consumes exactly that amount every day. It is an annualized average. A hot summer day with central air conditioning or a cold winter day in an electrically heated home can be far above the annual average, while mild spring and fall days can be much lower.
Average household electricity usage: day, week, month and year
| Period | National benchmark | How it is derived |
|---|---|---|
| Per day | 28.4 kWh | 863 × 12 ÷ 365 |
| Per week | about 199 kWh | 10,356 ÷ 52 |
| Per month | 863 kWh | EIA 2024 annual residential-customer average |
| Per year | 10,356 kWh | 863 × 12 |
If your utility statement covers an exact number of days, use those billing days rather than dividing by 30. Billing cycles are not always calendar months. EIA notes in its monthly electricity tables that sales can accumulate from bills covering roughly 28 to 35 days. For a personal comparison, a 31-day bill with 930 kWh means 30.0 kWh/day; a 28-day bill with the same 930 kWh means 33.2 kWh/day.
This is also why a 12-month total is normally the best way to answer how much electricity does a house use per day for your own home. It smooths out weather, vacations and seasonal HVAC loads instead of treating one unusual month as normal.
Why “residential customer” is not exactly the same as “house”
The EIA benchmark is an average per residential electric-utility customer account. That is not the same thing as an average detached single-family house. Residential accounts include many housing situations, including apartments, condos, townhouses and detached homes. The benchmark is therefore best used as a broad utility-customer comparison, not a promise about what a 1,500-square-foot or 2,500-square-foot house should consume.
Grid-delivered electricity is another important distinction. A home with rooftop solar can use electricity generated on site and buy less from the grid. EIA has highlighted this effect in Hawaii, where residential customers had very low average grid purchases despite high electricity prices. So a utility-meter benchmark can understate the total electrical energy actually used inside a solar-equipped home.
The current 2024 Residential Energy Consumption Survey status is useful here. EIA has released 2024 housing-characteristics information, but the full 2024 RECS consumption-and-expenditure tables are scheduled for spring 2027. That means detailed 2024 household electricity-consumption comparisons by building type, end use and other characteristics should not be invented before those official tables are released.
Why electricity use varies so much by state
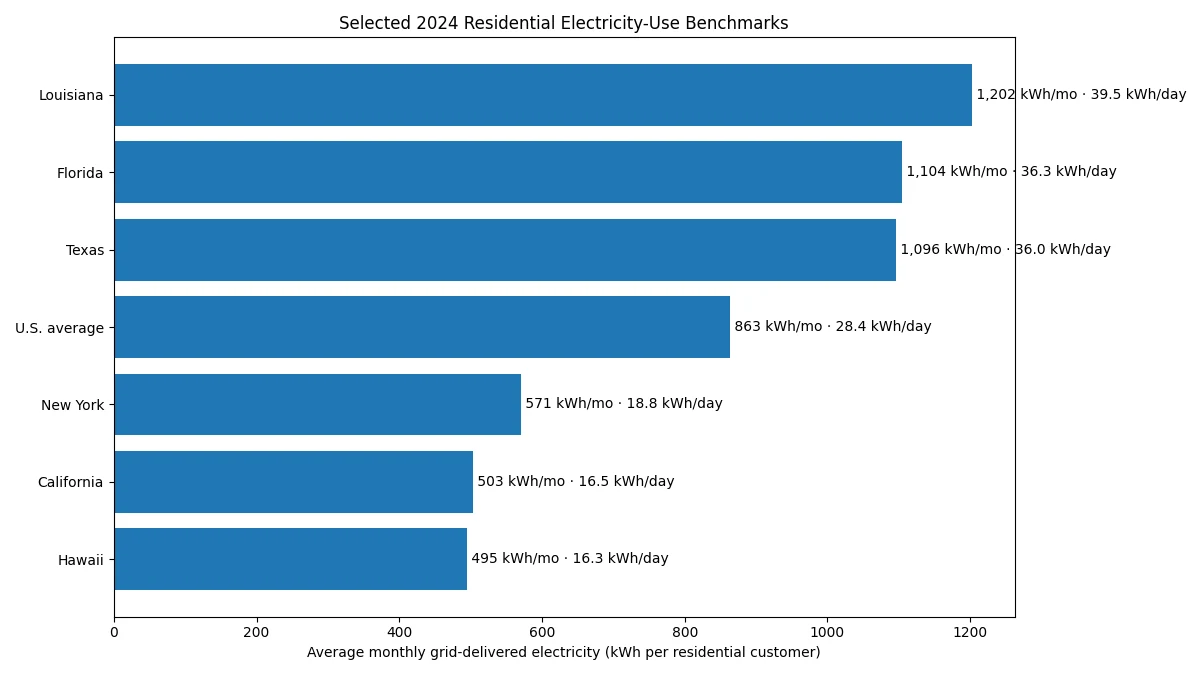
The national 863 kWh/month figure hides a very large geographic spread. In the same EIA 2024 table, Hawaii averaged 495 kWh/month of grid-delivered residential electricity, California 503 kWh, New York 571 kWh, Texas 1,096 kWh, Florida 1,104 kWh and Louisiana 1,202 kWh. Converted to annualized daily figures, those examples range from roughly 16 kWh/day to almost 40 kWh/day.
| Selected benchmark | 2024 monthly kWh | Annualized daily kWh |
|---|---|---|
| Hawaii | 495 | 16.3 |
| California | 503 | 16.5 |
| New York | 571 | 18.8 |
| U.S. average | 863 | 28.4 |
| Texas | 1,096 | 36.0 |
| Florida | 1,104 | 36.3 |
| Louisiana | 1,202 | 39.5 |
EIA’s analysis of the 2024 data explains part of the pattern: southeastern states tend to consume more electricity because air conditioning is heavily used in summer and electric space heating is more common there than in many colder regions where natural gas supplies more of the heating load. Louisiana had the highest average residential grid consumption in that analysis, while Hawaii and California were among the lowest.
That does not mean a Louisiana home is automatically inefficient or a California home is automatically efficient. Fuel choice, climate, rooftop solar, housing type and appliance mix change what passes through the electric meter. For the full state bill comparison, see Average Electricity Bill in the USA: State-by-State Guide.
How much season changes U.S. residential electricity use
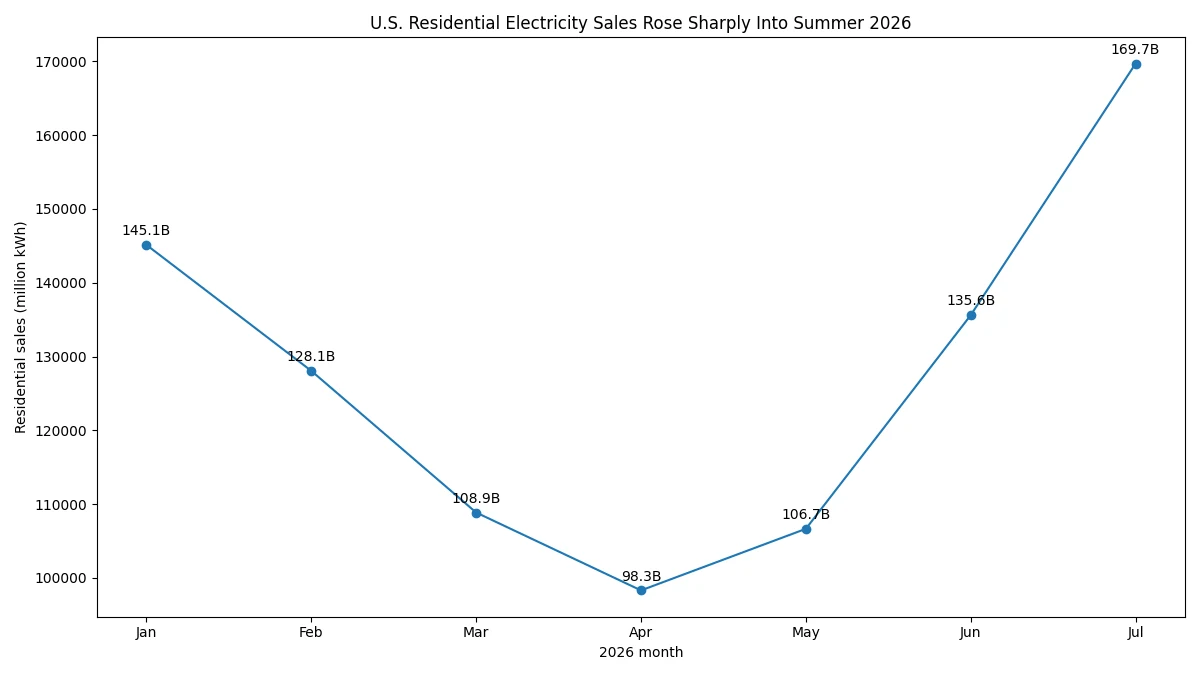
National electricity use is not flat through the year. EIA’s latest Electric Power Monthly Table 5.1 shows total U.S. residential electricity sales of about 98.3 billion kWh in April 2026, rising to about 169.7 billion kWh in July 2026. Those are nationwide sales totals rather than per-household figures, but the jump illustrates how strongly summer cooling can change residential demand.
January 2026 was also high, at about 145.1 billion kWh, which is consistent with winter electric-heating demand in many regions. The result is a U-shaped seasonal pattern at the national level: high winter use, lower shoulder-season use and another strong peak in summer.
For your own home, compare the same season year over year before concluding that usage is unusually high. A July-to-April comparison mostly tells you that weather and cooling load changed. A better diagnostic comparison is July this year versus July last year, then check whether thermostat settings, occupancy, equipment, EV charging or rate-plan behavior changed.
How to calculate your own daily household electricity usage
The simplest method uses the kWh line on your electric bill. Do not start from the dollar amount if the bill also includes fixed customer charges, taxes or other fees. Use electricity consumption directly.
Method 1: Use one billing period
Daily kWh = billing-period kWh ÷ number of billing days.
Example: if a 30-day bill shows 780 kWh, your average was 26 kWh/day for that billing period. This is useful for a quick check, but one month can be distorted by extreme heat, cold, travel or temporary equipment use.
Method 2: Use 12 months for a better normal
Add the kWh from your last 12 bills, then divide by 365. A home that used 9,600 kWh over a year averaged about 26.3 kWh/day. A home using 14,600 kWh averaged 40 kWh/day. These are calculations, not claims that either household is efficient or inefficient.
Method 3: Use utility interval data
Many utilities provide daily or hourly usage through an online account or smart-meter portal. That is the best data for finding specific spikes because it can show exactly when consumption increased. Compare a high-use day with outdoor temperature and major loads such as central AC, electric resistance heat, water heating, EV charging or a pool pump.
What usually drives household electricity consumption?
A national average is useful only if you understand the loads behind it. The biggest differences between homes usually come from a few structural choices rather than from small plug-in devices.
- Heating fuel: an all-electric home can put space heating on the electric meter, while a gas-heated home moves much of that energy use to the gas bill. See the heat pump vs electric resistance heating cost comparison.
- Cooling: central air conditioning can become one of the largest summer loads. See the central air conditioner running-cost guide.
- Water heating: electric resistance or heat-pump water heaters can materially affect monthly kWh. HomeBillLab’s heat pump water heater running-cost guide explains the electricity side.
- Climate and weather: longer cooling or heating seasons change HVAC runtime.
- Occupancy and schedules: more people generally mean more hot water, laundry, cooking, electronics and conditioned hours.
- Large discretionary loads: EV charging, pools, spas, workshops and extra refrigeration can add significant kWh.
- Equipment efficiency and controls: old HVAC, poor ducts, incorrect thermostat settings or electric resistance backup heat can raise consumption substantially.
- On-site solar: rooftop generation can reduce grid purchases even when the house itself still uses the electricity.
Appliances matter too, but it is better to calculate them from their own energy data than to guess a fixed share of the household total. HomeBillLab already has U.S. guides for refrigerators, clothes dryers, washing machines and dishwashers.
Is 30 kWh per day a lot of electricity?
At the national level, 30 kWh/day is close to the latest complete annual U.S. residential-customer average. It is slightly above the 28.4 kWh/day derived from the EIA 2024 annual table. But “a lot” depends on what the home uses electricity for.
A home that uses natural gas for space heating, water heating and cooking may reasonably sit well below the national electric average because major energy loads are paid on another bill. An all-electric home with a heat pump, electric water heating, an EV and heavy summer cooling can be above the national average without being unusually wasteful. This is why comparing your kWh with a similar fuel mix and climate is more useful than comparing square footage alone.
If your annual average suddenly rises from 25 kWh/day to 35 kWh/day with no obvious change in occupants, weather or equipment, the increase is worth investigating. A 10 kWh/day increase equals about 300 kWh in a 30-day month and 3,650 kWh over a year.
Turn household kWh into a cost estimate
Once you know your usage, the core energy-charge calculation is straightforward:
Energy charge = kWh used × electricity rate in dollars per kWh.
For example, 863 kWh at an illustrative 18¢/kWh energy rate equals about $155.34 before fixed charges, taxes or other bill items. Do not substitute that example rate for your utility tariff. Enter the cents-per-kWh figure from your own plan in the U.S. Electricity Bill Calculator. If you need help separating the rate from the monthly bill, see Electricity Cost per kWh USA.
2026 data freshness: what is current and what is still pending
The 863 kWh/month benchmark is from EIA’s latest complete annual residential-customer table, covering 2024. EIA’s current monthly power data is much fresher: the September 24, 2026 Electric Power Monthly release includes residential sales through July 2026. Those monthly figures are preliminary and are most useful for current national demand and seasonal context.
The 2024 Residential Energy Consumption Survey is newer in survey year, but EIA has not yet released its full consumption-and-expenditure tables. The agency’s September 2026 RECS status page says the full 2024 data will be released in spring 2027. When that happens, it should support better comparisons by housing characteristics and end use without relying on unsupported rules of thumb.
HomeBillLab will therefore keep the national utility-customer benchmark clearly dated, use current monthly EIA data only for current context, and update this guide when a newer official annual consumption benchmark or the full 2024 RECS consumption tables become available. See the HomeBillLab Methodology for our approach to changing source data and calculation assumptions.
Household electricity usage FAQ
How much electricity does a house use per day on average?
The latest complete EIA annual residential-customer benchmark is 863 kWh per month for 2024. Annualized, that equals about 28.4 kWh per day. Treat it as a national benchmark rather than an expected number for every detached house.
How many kWh does the average U.S. home use per month?
The latest complete EIA annual utility data reports 863 kWh per month per residential customer account in 2024. State averages ranged widely, from under 500 kWh in some places to over 1,200 kWh in Louisiana.
How many kWh per year does the average household use?
Annualizing the 863 kWh monthly benchmark gives about 10,356 kWh per year. Your own 12-month bill total is a better figure for household-specific comparisons.
Is 20 kWh per day low?
It is below the national residential-customer average, but that does not automatically mean the home is more efficient. Gas heating, gas water heating, apartment living, mild weather or rooftop solar can all reduce grid electricity purchases.
Is 50 kWh per day high?
It is well above the national annualized average of about 28.4 kWh/day. Whether it is unusual depends on climate, electric heating, cooling, EV charging, pools, home size and occupancy. Compare your 12-month trend and similar seasons before deciding that the usage is abnormal.
Should I estimate daily electricity use from my bill amount?
No. Use the kWh consumption line whenever possible. Dollar bills can include fixed charges, taxes, time-of-use rates and other adjustments that make a dollars-to-kWh estimate inaccurate.
Bottom line
For a current official baseline, the answer to how much electricity does a house use per day in the USA is about 28.4 kWh/day when the latest complete EIA residential-customer average of 863 kWh/month is annualized. That is roughly 10,356 kWh/year. Your actual home can be far below or above it because climate, heating fuel, cooling, water heating, occupancy, EVs, pools and rooftop solar all change what passes through the meter. Use 12 months of your own kWh whenever possible, then compare cost with your actual tariff. Browse more guides in the U.S. Electricity hub.